
- Helps demonstrate effect of actual crew actions on entire downhole well profile, fully integrating multiple, simultaneous effects.
- Calculates and continuously displays pressures at all well depths, thus clarifying critical relationships. Live data feed from rig sensors allows system to continuously and concurrently monitor downhole pressure relationships, well as rig and crew performance.
- Discrepancies with corroborating data can provide alert to presence of unpredicted parameter changes.
- Displays consequences of complex changes in pore pressure, formation strength, hydraulics, geometry and string movements, even when corroborating data feeds (such as PWD readings) become temporarily unavailable (as during connections or trips)
- Automatically stores data to facilitate generation of new, ad hoc simulations (using Standalone features) to permit efficient field evaluation of operational alternatives.
- May be linked to remote SafeVision Well Data systems to permit off-site monitoring and collaboration based on common source data.
- Well configuration data is entered manually, but may be updated automatically from data feeds and/or “snapshots”
- Data needed for concurrent, real-time “Simulation While Drilling” is pulled from existing rig sensors, where adequate or from dedicated gauges/sensors installed as needed.
- System includes extensive preloaded rig, tubular and fluids data, with “advanced user” options to permit input of detailed field measurements
- Default data values permit rapid system set-up, but can be over-written to match actual field measurements.
- Batch entry, using copy and paste from Excel files, enables entry of detailed or actual well data to facilitate replication of complex field scenarios
- Data needed for calibration and ongoing system performance monitoring may be input automatically or manually.
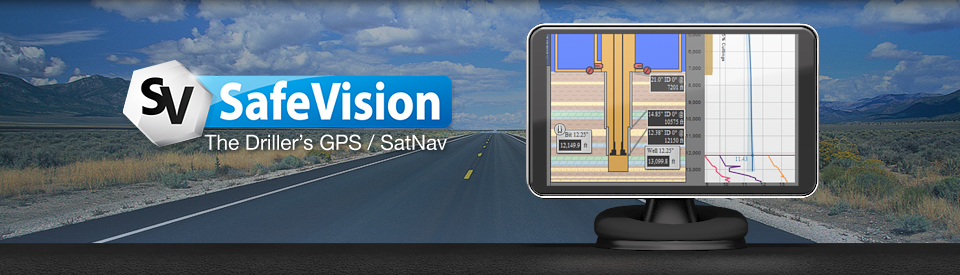
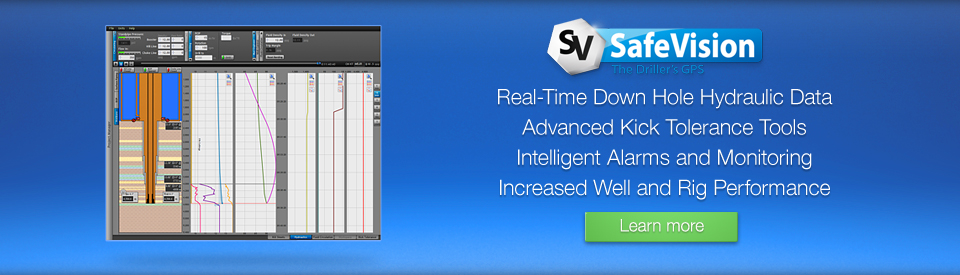
- Well sketch provides continuous display of well geometry, with the same graphic displayed on all system monitors
- Flow paths and control devices are customized to match rig equipment
- Specific drill string components are continuously tracked, with detailed positions available for display in real time.
- Multiple, customized monitors and user interfaces rationally limit system entries to meet operational and data security needs, as well as installation safety and ergonomic requirements
- Well sketch shows scaled diameters and depths
- Sketch updates to display results of simulations based on live data feeds.
- Depth-based graph is linked to the well sketch and displays critical downhole pressures and pressure limits using equivalent density units
- User-defined time-based logs can be used to record simulated and actual data useful for identification of operational events as well as system calibration confirmation.
- Real-time Kick Tolerance Analysis
- Output data can be transferred by secure internet link to be displayed in real time at remote locations.
- Ability to customize displays, user alarms
- Information displayed is simulated concurrent with real-time data. Automatically stored simulated data provides opportunity for subsequent comparison with real-time input data records, facilitating post-event well problem identification and evaluation.