
- Helps demonstrate effect of actual crew actions on entire downhole well profile, fully integrating multiple, simultaneous effects. This makes it particularly useful for look-backs and related training.
- Calculates and continuously displays pressures at all well depths, thus clarifying critical relationships. If using live data feed from a rig, this facilitates monitoring of downhole relationships as well as rig and crew performance
- Identifies anomalies in real-time data, indicating and alerting to presence of unpredicted parameter changes
- Displays consequences of complex changes in pore pressure, formation strength, hydraulics, geometry and string, even when corroborating data feeds (such as PWD readings) become temporarily unavailable (as during connections or trips)
- While using real-time data, “snapshots” can be stored to facilitate generation of new, manual simulations (using Standalone features) to permit evaluation of operational alternatives
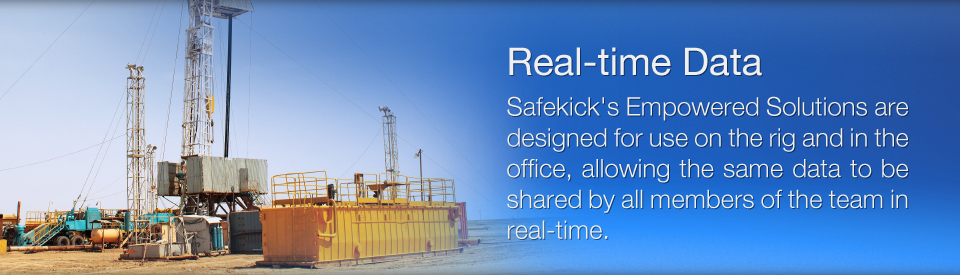
- Simulations are controlled using operating data input from real-time rig data feeds
- Data can be received via OPC, WITSML, or directly from a SafeVision rig package
- Default data values permit use of incomplete field data, but can be over-written when appropriate field data is available
- Batch entry, using copy and paste from Excel files, enables entry of detailed or actual well data to facilitate replication of complex field scenarios
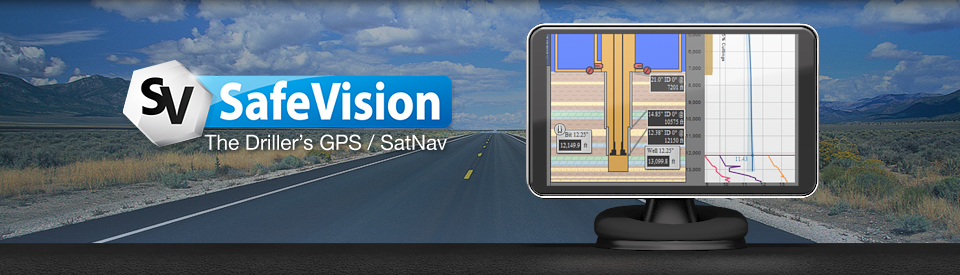
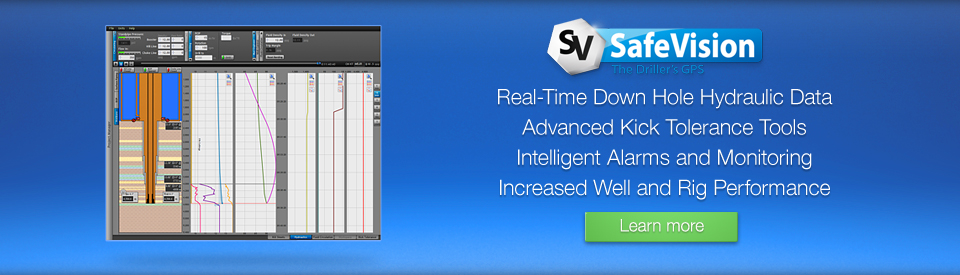
- Well sketch provides continuous display of well geometry
- Well sketch shows scaled diameters and depths
- Sketch updates to display results of simulations linked to either live or recorded real-time data
- Depth-based graph is linked to the well sketch and displays critical downhole pressures and pressure limits using equivalent density units
- User-defined time-based logs can be used to identify relevant operational events
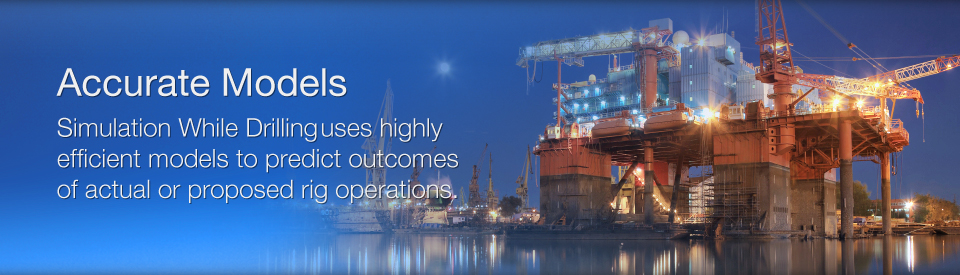
- Simulation While Drilling feature makes it easy to look ahead and plan for any changes
- Real-time Kick Tolerance Analysis
- Ability to review all depth and time based data at any time